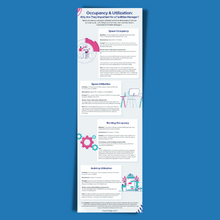
Occupancy and Utilization: Why Are They Important For a Facilities Manager?
The Facilities/CRE/Workplace sector has a language problem. We use a long list of terms and concepts that may have multiple, or even conflicting, definitions. “Occupancy” and “utilization” are two that are often used synonymously, but it’s crucial for us to understand the differences between these two concepts. Once we’re clear on this, we can better determine what technology we need to capture these metrics and make great workplace planning decisions.
Our language is often centered around “place”—where people are working. We’ve got agile, flexible, activity-based, smart working, and thanks to the global pandemic, we’re all talking about “hybrid”. When it comes to the employee experience, a physical space can and should enable great work. But before considering the location and the physical space, we have to consider culture, processes, and technology.
We have to first understand why people work, how they work, and when. For many, the location no longer matters. The global pandemic has shown there is another way—and that other way needs data-driven decision-making.
Conexus, the Relogix SaaS platform, enables data to be collated so you can look at it through a single pane of glass. It provides a single source of truth for many metrics, including occupancy and utilisation, to drive informed decision-making.
Conexus can answer your key questions:
- How many people are attending the physical workspace each day?
- How did people intend to behave in these spaces?
- How are they actually behaving and using these spaces?
- How much space does our organisation need?
- What types of space do people need?
- How many of those different types of space do people need?
Facilities Management Isn’t Really About Facilities
Facilities Management isn’t about managing brick and mortar spaces anymore—it’s about people. Our goal is to create and deliver an employee experience that allows people to thrive at work. Data-driven decision-making must underpin this—it can inform cleaning schedules, catering, and provide resources to inform the design of spaces.
We know Facilities Managers have busy schedules. They fight for budgets, have too many spreadsheets on the go, and manage a fast-paced and dynamic environment. That’s why Conexus brings live data into a single pane of glass to take this pain away!
Understanding the data within our spaces is crucial. Not just for employee experience and business efficiency, either. There are far- and wide-reaching impacts, much further and wider than many probably imagine.
Pre-pandemic, office utilization sat between 45-55% on average globally. But as Neil Usher’s article this week has highlighted, the office occupancy rates in London are currently at 27%. And considering the CRE sector is estimated to consume 40% of global energy annually, accounting for a third of international carbon emissions—Houston, we have a problem.
What does space utilization have to do with the planet? Humans are keen to get out of the building if it’s on fire, but are workplaces truly considering that they’re fuelling the fire that our climate is currently burning in?
CIBSE reports that each unused desk in an office is, on average, contributing one tonne of unnecessary CO2 every year. To give this some context, that equates to around 2,500 miles of driving, about the distance from Boston, Massachusetts to Salt Lake City, Utah. Or if you want to be truly alarmed, look at the recent public health studies produced—for every 4,434 metric tonnes of CO2 produced, one person globally will die.
To drive change, we must understand. And to understand, we must start by collating data.
Space Occupancy and Space Utilization: 4 Key Data Points
Space occupancy and space utilization are terms that people often use synonymously. Let’s start by demystifying what they mean and why they’re important for Facilities Managers.
1. Space Occupancy
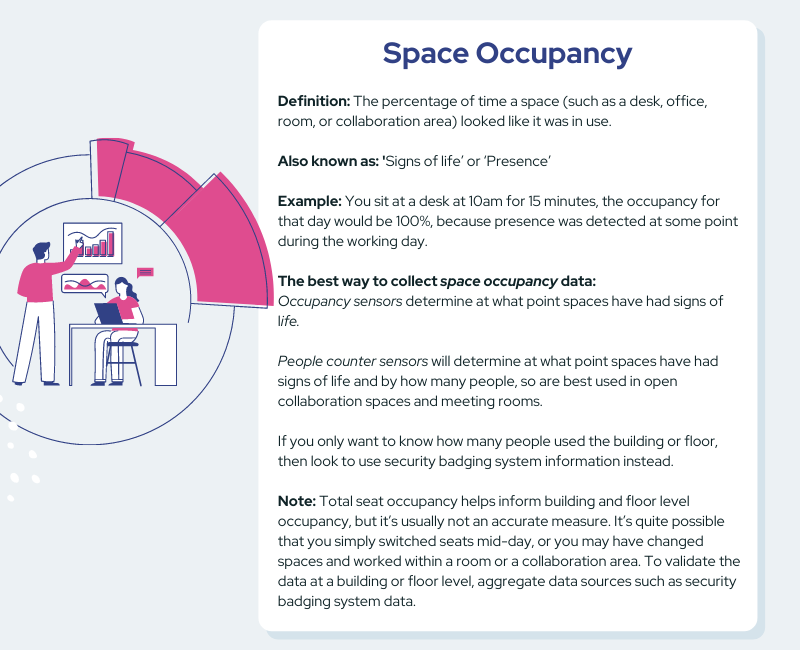
Also known as “signs of life” or “presence,” space occupancy is the percentage of time a space (such as a desk, office, room, or collaboration area) looked like it was in use.
For example, when you sit at a desk at 10 AM for 15 minutes, the occupancy for that day would be 100%, because presence was detected at some point during the working day.
The best way to collect space occupancy data is with occupancy sensors. Occupancy sensors determine at what point spaces have had signs of life.
People counter sensors will determine at what point spaces have had signs of life and by how many people, so are best used in open collaboration spaces and meeting rooms.
If you only want to know how many people used the building or floor, then look to use security badging system information instead.
Note that total seat occupancy (how many seats were used at some point during the working day) can help to inform building and floor level occupancy, but it’s usually not an accurate measure. It’s quite possible that you simply switched seats mid-day, or you may have changed spaces and worked within a room or a collaboration area. To validate the data at a building or floor level, aggregate data sources such as security badging system data.
2. Space Utilization
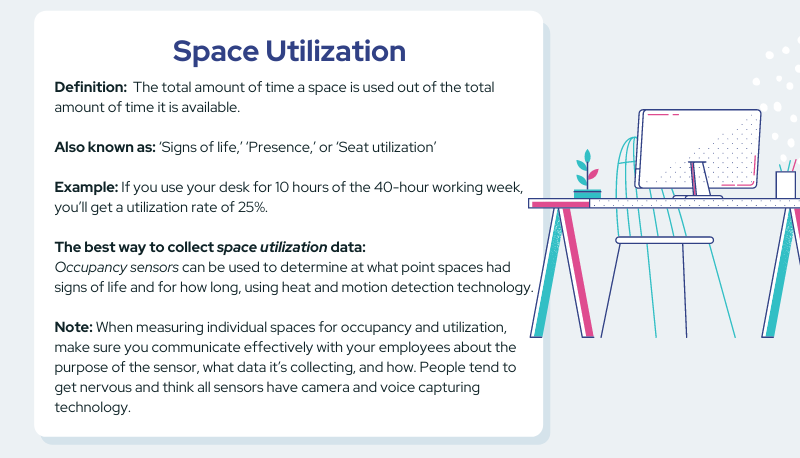
Also known as “signs of life,” “presence,” or “seat utilization,” space utilization is the total amount of time a space is used out of the total amount of time it is available.
So, if you use your desk for 10 hours of the 40-hour working week, you’ll get a utilization rate of 25%.
Occupancy sensors can be used to determine at what point spaces had signs of life and for how long, using heat and motion detection technology.
When measuring individual spaces for occupancy and utilization, make sure you communicate effectively with your employees about the purpose of the sensor, what data it’s collecting, and how. People tend to get nervous and think all sensors have camera and voice capturing technology.
3. Building Occupancy
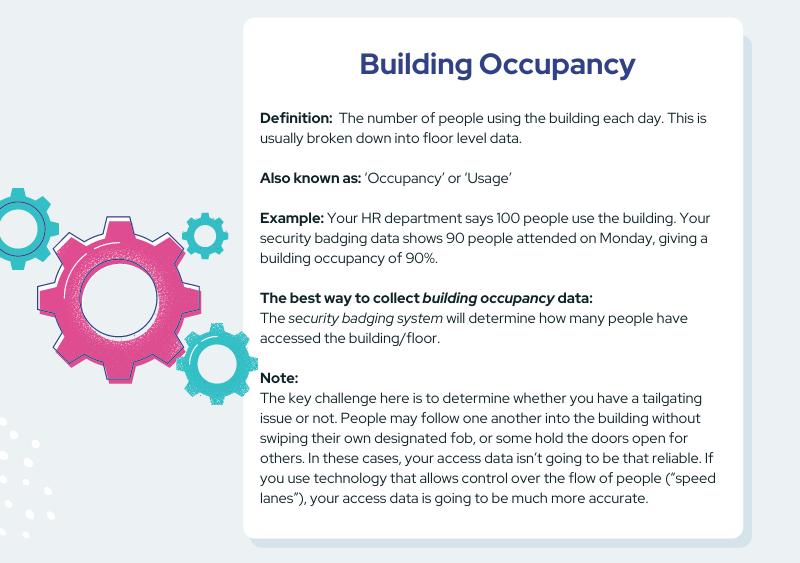
Also known as “occupancy” or “usage,” building occupancy is the number of people using the building each day. This is usually broken down into floor level data.
For example, your HR department says 100 people use the building. Your security badging data shows 90 people attended on Monday, giving a building occupancy of 90%.
The best way to see this data is with your security badging system. It will determine how many people have accessed the building and/or floor.
The key challenge here is to determine whether you have a tailgating issue or not. People may follow one another into the building without swiping their own designated fob, or some hold the doors open for others. In these cases, your access data isn’t going to be that reliable. If you use technology that allows the control over the flow of people (“speed lanes”), your access data is going to be much more accurate.
4. Building Utilization
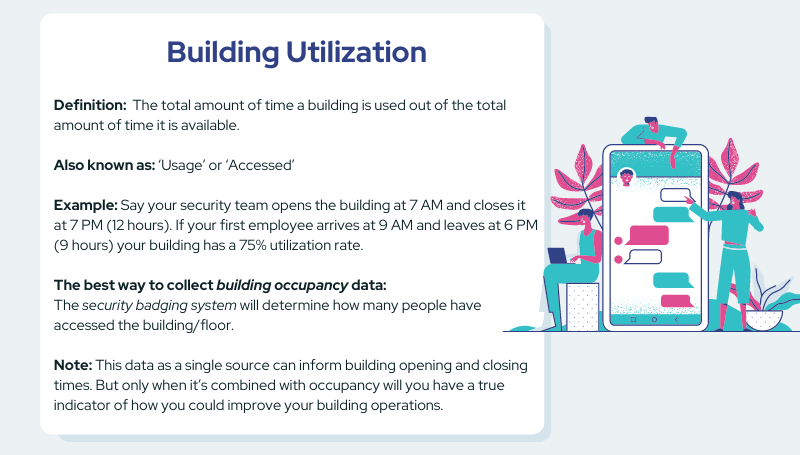
Also known as “usage” or “accessed,” building utilization is the total amount of time a building is used out of the total amount of time it is available.
Say your security team opens the building at 7 AM and closes it at 7 PM (12 hours). If your first employee arrives at 9 AM and leaves at 6 PM (9 hours) your building has a 75% utilization rate.
Again, the security badging system will help you best determine how many people have accessed the building and at what time.
This data as a single source can inform building opening and closing times. But only when it’s combined with occupancy will you have a true indicator of how you could improve your building operations.
Dealing with Complexity in Data Collection: How Conexus Can Simplify It All
How people say they will behave and how they actually behave are often quite different. One of the hardest lessons to learn in user experience is that researchers can’t always trust what test participants tell them.
Behavioural psychologists have long understood that people are not entirely rational creatures. We’re influenced by many factors—emotionally, cognitively, and rationally—which drive us to “bend the truth”.
- Social conformity – What do people think their environment is telling them to say, do, and want? Part of this is considering the , which is when study subjects alter their behaviour precisely because they’re aware they’re being observed.
- Wishful thinking – People say what they’d like to be true.
- Context – People respond differently in different contexts.
- Mindset – Daniel Kahneman suggests another reason we can’t predict our own behaviour in his book Thinking, Fast and Slow. Our “system one” mindset is fast, instinctive, and driven by emotion. The “system two” mindset is just the opposite: slower, more deliberate, more rational. When people attempt to predict what they’ll do in a particular context, they use system two to weigh the options rationally. When people actually make a decision, they’ll use system one, which responds instinctively.
If we look at these within the realm of how organizations capture occupancy and installation, we can see how these factors will influence the data we’re trying to gather.

With so many factors in the works and so many different ways of capturing data, it’s key that organisations make decisions based on the right data. Conexus integrates and layers data sources to surface data stories:
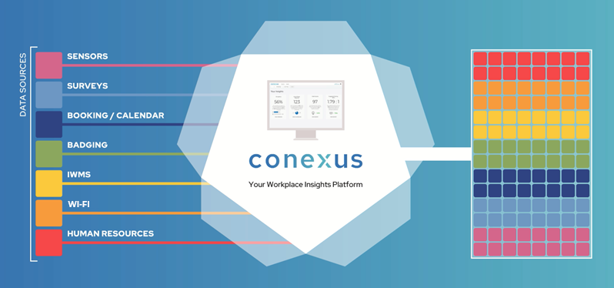
By collating and aggregating data, Facilities Managers will be armed with the right insights to enable key decisions on space and how it impacts the employee experience. You’ll be able to co-create a place that people actually want to go to, all the while making sure the space is aligned to and a value driver of business needs.
The last few years have highlighted not only how the world moves on quickly, but also how it never stands still. Clipboard studies and siloed data sources are a thing of the past. Nothing stands still or operates in isolation—so your data collection can’t stand still or sit in siloes either.
Using Conexus, Facilities Managers will have access to a single pane of glass to inform and enable data-driven decision-making that will impact the employee experience. You’ll be able to take into account multiple data sources to understand people’s desires and intentions, how they actually behave, and how this translates into business efficiency and impact on the planet.
To drive change, we must understand. To understand, we must start by collating data.

