The Best Way to Make the Most of Your IWMS Data
The employee behaviors that informed and shaped the workplaces of yesterday are evolving. Why people go to the office continues to be in flux as we learn to adapt and live with the new consequences of being in the workplace together. How much time we spend at the office, what we do there, and what spaces we need to be productive is a moving target and will continue to be, for some time.
And since employee behavior is what should ideally shape the workplace itself, this makes workplace planning extra challenging. Organizations need some reliable way to understand what’s changing, and whether those changes are temporary or here to stay. To do this, we need reliable data that shows us the nuances of what’s happening in the workplace.
The need for this data is at an all-time high right now. Important decisions need to be made—like how much space do we need, how do we go about occupancy planning, what needs to change in our workplace design and how do we support employees working at the office. Pre-pandemic data collection often referenced a static moment in time. Today, with constantly changing protocols impacting employee behaviors, timely access to data is key.
Expected Behaviours and Workplace Design

Workplace design is integral to the smooth functioning of an organization. As such, the goal to “get it right” from the start means having access to current, relevant, and telling data, to guide and inform.
To design a workspace, planners and designers need to understand how people use and interact with the spaces available in the office. Static data from sources like surveys, utilization studies, workshops, or interviews with employees, as well as calendar data and desk and room reservation data are often referenced for insights. However, the insights are limited and mostly about user intent, preferences, and overall satisfaction.
All this data is collected, analyzed, and then transformed into a workplace program that becomes the workplace design plan, which goes on to inform the requirements for construction, furniture and fixturing. Once there’s a design, the workplace program becomes the workplace standard that is input into an IWMS tool—the system of record for the design and functionality of a workplace and its workspaces.
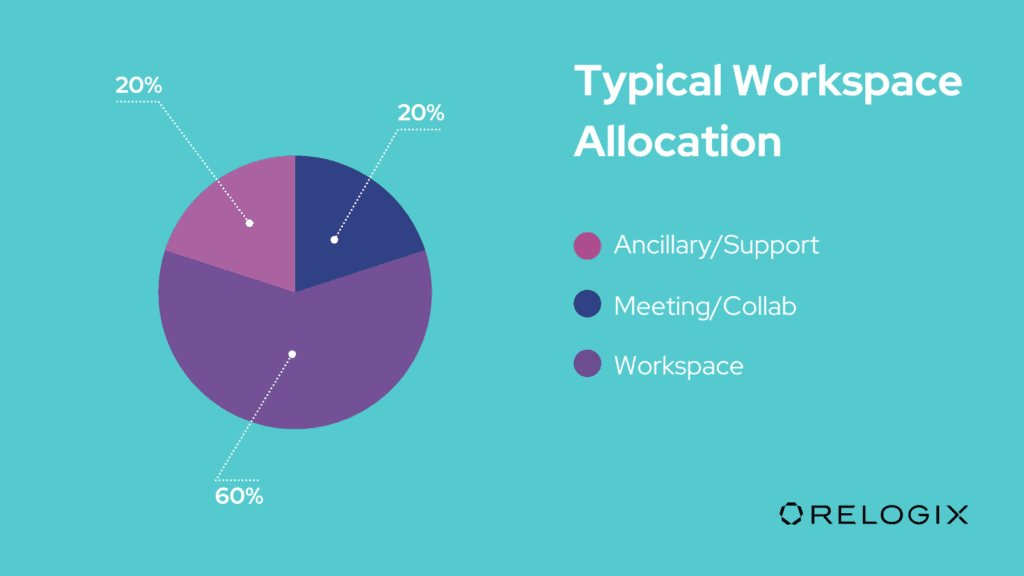
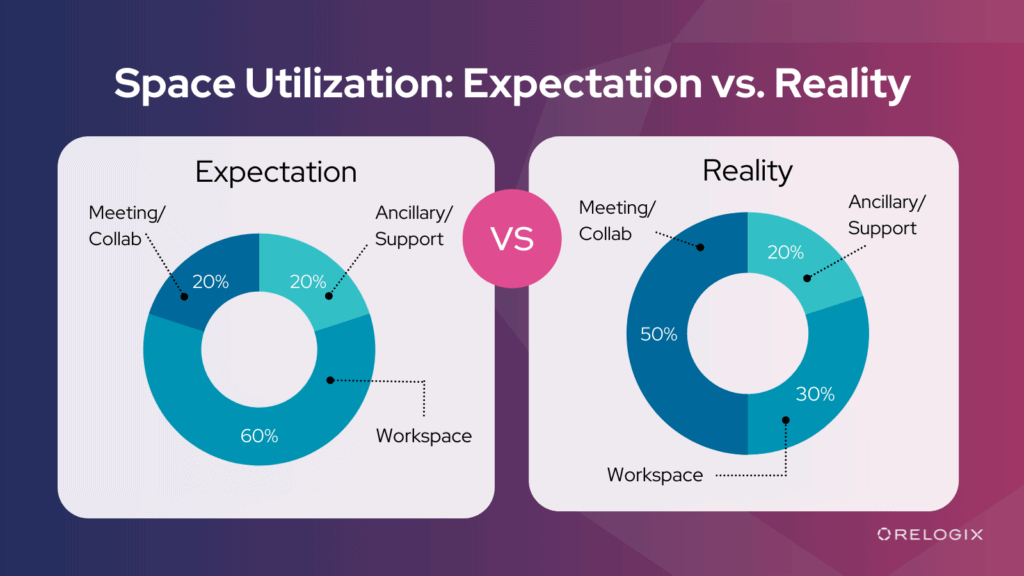
Therefore, when we look at data that comes from an IWMS module, we can baseline the current design intent. The current space allocation, sharing ratios, space types, and sizes tell us how we planned for employees to use the spaces provisioned. For example, an organization might be able to pull the following information out of their IWMS module, which shows that they expected people would work individually 60% of the time, in ancillary spaces 20% of the time, and in collaboration 20% of the time.

Specific data points can also highlight what mattered most to the company at the time the design was approved. For example:
- If a high percentage of space is allocated to meeting rooms, it means that in-person collaboration is highly valued
- If there are more people than seats, it means that some level of remote work was already occurring and/or was expected
- If there is mostly open space, it means the organization supports open collaboration. If the spaces are mostly closed off, it indicates more structure and hierarchy
You can tell a lot about what the organization values by just looking at IWMS data and how much and what types of spaces are allocated. It’s worth noting too that IWMS only changes if there’s a change to the physical space or there is a re-organization and/or a space re-allocation. On its own, IWMS data is not enough to support planning and design changes. The usefulness of IWMS data is greatly enhanced when it is combined with the right source of actual space use data that originates from space-level sensors.
When Behavior Data Guides Change
How do we actually keep up with evolving employee needs? How do organizations determine what needs to be changed in a space?
The key is combining static IWMS data with real-time data. By blending these two data sets, we can stay ahead of the evolving workplace changes continuously so that we can be more proactive in our planning and design efforts.
Static data alone simply isn’t enough—knowing all about seat allocation at the time the design was made can show us what the designers intended for the space, using data from a specific moment in time, which may no longer apply to support the changing use of that same space. Without sensors, you can’t see what space types are being used or how they’re being used, which usually differs from what was planned—people are going to improvise to suit their needs.
Space-level sensors track metrics like occupancy, utilization, dwell time, and churn, which tell you about the actual use of each individual space. When you look at this usage data in aggregate, you can compare it to what was planned, and determine where changes need to be made. Comparing intended behavior with actual behavior removes the assumptions made at the design stage that were based only on manual data sources.
Combining these two data types, an organization might see that in reality, their spaces are being used differently than was anticipated.

As another example, IWMS might indicate a person-to-seat ratio of 1:1 for Finance, and 2:1 for Sales. Through collecting sensor data based on actual behaviors, we might be able to see that the required ratios are 1:5 for Finance and 3:1 for Sales. What appears to be a slight change in sharing ratio can have a significant impact on the total seats and overall square footage required to support new demand for workspace.
In addition, a particularly useful metric that only sensors can capture is dwell time. Dwell time refers to the total uninterrupted use of a seat—for example, an employee was at their desk from 9AM to 10AM, 10:30 AM to 12:30PM, and then 2PM to 5PM. This shows us the desk churned 2.67 times, a new and much more accurate “go-to” metric for that improves occupancy planning.
If you’re thinking that there isn’t enough data yet because use of space is so low, good data is not as much about volume as it is about quality. You don’t need a lot of data to identify clues to potential design changes that correlate with new behaviors. Those who venture back into the office will leave a trail of “data crumbs” —it’s minimal data, but still enough to see a picture of what’s changed about how people interact with the space. Even if only 15 or 20% of your workforce is back at the office, you’ll be able to spot where potential changes can be made.
Especially during this return-to-work period and as the pandemic continues on, updating workspaces based on static and dynamic data are an excellent way to improve employees’ experiences at work. Adapting the workspace to changing needs will give stronger feelings of psychological safety, which is just as important to employee satisfaction as actual safety. It’s just one of the barriers to enticing workers back to the office, but a difficult one to surmount without the right type of data.
The workplace and how employees use it isn’t static. It never was. But now, more than ever before, office use is changing and evolving. With so much uncertainty still looming thanks to the new Omicron variant, no one knows what the future holds. That being said, there is no time like the present to learn about how the employees who want to come back to the office are behaving so you can understand their needs. This allows us to inform improved workplace designs to better suit the new and emerging ways of working in your organization. The success of your office is dependent on how well you understand your employees’ actual needs. And to do that well, sensor data that reflects your organization’s new reality is the key.

